INTRODUCTION
Candlestick patterns are one of the most powerful tools in a trader’s arsenal, providing visual insights into market sentiment, trends, and potential reversals. Yet, many beginners find them confusing and overwhelming. If you’re struggling to understand candlestick patterns, don’t worry—you’re not alone! This article will break down the basics, explain common patterns, and provide actionable tips to help you master them.
What Are Candlestick Patterns?
Candlestick patterns are visual representations of price movements over a specific time period. They are a key component of technical analysis, allowing traders to analyze market trends and make informed decisions.
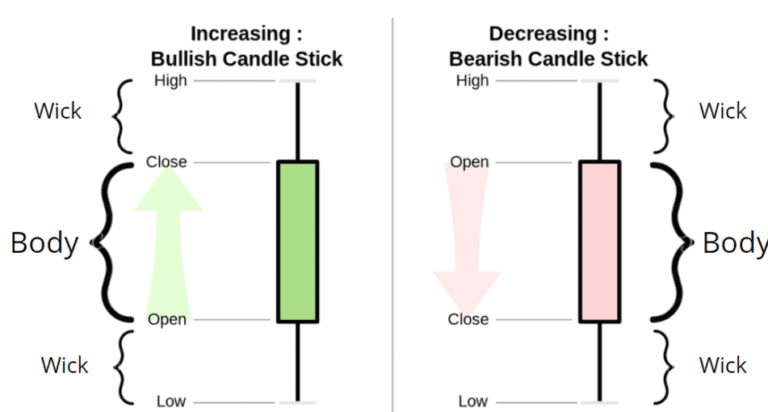
A candlestick consists of three main parts:
The Body: This indicates the difference between the opening and closing prices. A long body signifies strong buying or selling pressure, while a short body shows little price movement.
The Wicks (or Shadows): These thin lines extend from the body and show the highest and lowest prices during the time period.
Colors: Green (or white) candles indicate a bullish movement (closing price higher than opening), while red (or black) candles signify a bearish movement (closing price lower than opening).

Why Are Candlestick Patterns Important?
Candlestick patterns are crucial because they provide:
Market Sentiment Insights: They reveal whether buyers or sellers dominate the market.
Trend Identification: Patterns help traders recognize when trends may start, continue, or reverse.
Enhanced Decision-Making: Compared to line charts, candlestick charts offer richer details, helping traders react more effectively.
By interpreting candlestick patterns, traders can anticipate market movements with greater confidence.
Common Types of Candlestick Patterns
Candlestick patterns can be categorized into single, double, and triple patterns. Below are examples of each type:
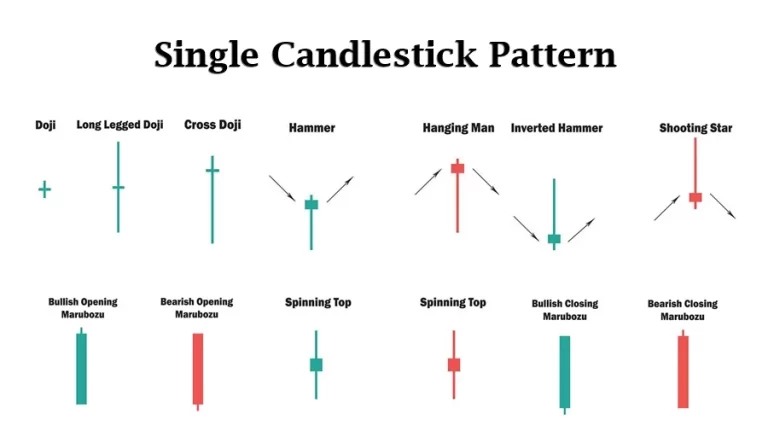
Single Candlestick Patterns
Doji: Indicates indecision in the market; the opening and closing prices are almost identical.
Hammer: A bullish reversal pattern that appears after a downtrend, characterized by a small body and long lower wick.
Spinning Top: Shows market indecision, with small bodies and wicks of similar length.
Double Candlestick Patterns
Double Bottom pattern
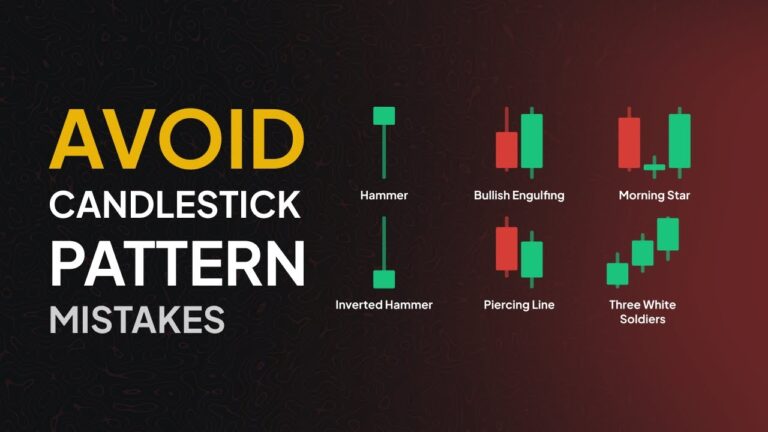
Bullish Engulfing: A strong bullish signal where a green candle fully engulfs the previous red candle.
Bearish Engulfing: Indicates a bearish reversal, with a red candle engulfing the previous green candle.
Tweezer Tops/Bottoms: Show potential reversals, with two candles having almost identical highs or lows.
Triple Candlestick Patterns
Morning Star: A bullish reversal pattern involving three candles: a long red candle, a small-bodied candle, and a long green candle.
Evening Star: The bearish counterpart of the Morning Star, signaling a downward reversal.
Three White Soldiers/Three Black Crows: Represent strong bullish or bearish trends with three consecutive green or red candles.

How to Read Candlestick Patterns: Step-by-Step Guide
1- Identify the Pattern: Learn to recognize the shape and sequence of patterns. 2- Analyze the Context: Look at the overall trend (uptrend, downtrend, or sideways). 3- Combine with Indicators: Use other tools like moving averages, RSI, or volume analysis to confirm the pattern’s validity. 4- Avoid Common Pitfalls: Avoid making decisions based solely on candlestick patterns without considering market conditions.
Tips for Learning and Practicing Candlestick Patterns
Start Simple: Focus on mastering a few basic patterns like the Doji or Hammer before tackling complex ones. Use Historical Data: Study candlestick patterns on historical charts to understand how they played out in different scenarios. Leverage Technology: Many trading platforms offer automated tools for recognizing candlestick patterns. Use these to speed up learning. Practice with Demo Accounts: Apply your knowledge in a risk-free environment to build confidence.
Mistakes to Avoid When Learning Candlestick Patterns

Ignoring Market Context: Candlestick patterns are most effective when analyzed alongside broader market trends. Trading in Low-Volume Markets: Patterns in low-volume markets are less reliable due to fewer participants driving price action. Overtrading: Acting on every pattern without confirmation from other indicators can lead to unnecessary losses.
conclusion
Understanding candlestick patterns doesn’t have to be daunting. By learning the basics, studying common patterns, and practicing regularly, you can decode the market’s movements and make more informed trading decisions. Remember, mastering candlestick patterns is a journey, and persistence is key. Start small, stay consistent, and watch your skills improve over time.
FAQ'S
What’s the easiest candlestick pattern for beginners to learn?
- The Doji is a great starting point because of its simplicity and clear indication of market indecision.
How many candlestick patterns exist?
- There are dozens of candlestick patterns, but only a handful are widely used and worth learning initially.
Are there tools to automate candlestick pattern recognition?
Yes, many trading platforms and software tools can identify candlestick patterns for you.

